The future of Live Interactive Learning: ½ day sessions using Zoom - with the topics you need - just when you need them.
We NEVER cancel a course - even if there's only one attendee!
No scheduled course when you want it? Easy - just schedule one on the dates you prefer!
Maximum class size of 6   +   Short ½ day sessions   =   Better learning outcomes + Less time away from work.
Independent instructors with lower overheads = Better value for money options.
Cancel or reschedule up to 24 hour in advance + Money back guarantee = NO RISK! 
Free and indefinite post-course support from your instructor = We care about and support your learning journey all the way.

Power BI: Kickstarter

Learn to use Power BI to connect to your data and create powerful, interactive, actionable reports using a range of core visualisations.

In this course you will learn:

  • What the main components of the Power BI ecosystem are, what do they do and where do they fit into the big picture.
  • How to create multi-page reports containing interactive visuals using some of the core visualisations.
  • How to use Power Query to connect to single and multi-table data sources; clean, tidy and simplify the data ready for report creation.
  • How to use DAX formula language to add calculations and round out your data model for report creation.
  • How to publish a report to your personal workspace in the Power BI Service, and how shared workspaces work.

A more detailed breakdown of the course topics is shown at the end of this page. Click here to see.

Current Scheduled Courses

Click Book New to schedule a course on your preferred dates.
Seats: 6

Pre-course Requirements

Required knowledge. Before you can attend this course, you must be competent using a PC and the Windows operating system.

Useful knowledge. The following skills and knowledge might be useful, but are not essential to have. We cover these topics in the course, but knowing a little about these topics may give you a head start.

  • Some knowledge of Microsoft Excel Formulas and Functions.
  • Understanding of what a relational database is, and how a one-to-many relationship works.

Pre-course learning topics. There are some pre-course learning topics to complete in the form of videos with cheat sheets. These are important to watch as they are assumed knowledge for the course and are only covered in revision in the sessions. These will be sent out to the participants after the booking is complete.

Pre-course Setup Checklist. There is a pre-course setup checklist which you must complete before your first session to ensure you have the correct software and hardware installed and configured before you can attend the course. This will also be sent out to the participants after the booking is complete.

Training Resources

The following resources are provided as part of this course:

  • Reference Book: Introduction to Power BI (Microsoft Press). This book is not used within the course, but is provided to allow participants to refer back to the topics, or dive deeper into topics of interest following the course.
  • Cheat sheets. Core concepts and some 'how to' guides are provided in cheat sheets to help apply the knowledge and skills back in the workplace.
  • Exercise files. Class exercise files and data sources are provided, which are used during the sessions and which can also be used for further practice after the sessions.
  • PowerPoint Slides. A copy of the PowerPoint slides used throughout the course will be provided so that participants do not need to try and copy slides, or write extensive notes throughout the course.

A link to download the training resources in 'zip file' format will be sent out to students after booking for the course. These files will need to be extracted prior to the first session.

What's next?

The following courses follow on from this course and will further enhance your knowledge and skills:

For the full Power BI course offerings and pathways click here.

Topics in detail

In this 4-session course, you will learn:

  • What the main components of the Power BI ecosystem are, what do they do and where do they fit into the big picture.
  • How to create multi-page reports containing interactive visuals using some of the core visualisations.
    • How to use the Power BI Desktop application and what the three views are used for.
    • The difference between a storage model and an analysis model.
    • How to use single table and multi-table analysis models to create reports.
    • How to create multiple visuals on a single page to create an interactive dashboard for report users.
    • How to set up, change and format visuals
    • How to use the core visual types, including charts, slicers, tables, pivot tables and KPI visuals like cards and gauges.
    • How to work with multiple pages in your reports.
    • Understand what a calendar table is and why it is important for breaking down date-based data.
    • How to create timelines to display date based data.
    • How to use maps for geographical displays of data.
    • How to use the filter pane to apply higher level filtering of your data.
  • How to use Power Query to connect to single and multi-table data sources, clean, tidy and simplify the data ready for report creation.
    • How Power Query fits into the Power BI report creation process.
    • How to connect to a single table in a data source.
    • How to use Power Query to clean and tidy a table ready for report design.
    • How to clean and transform table columns such as splitting, combining and fixing inconsistent data.
    • How to perform table transformations such as removing rows, removing duplicates and unpivoting tables.
    • How to add simple calculated columns to tables using Power Query.
  • How to use the DAX formula language to add calculations and round out your data model for report creation.
    • What DAX is and how it is used to enhance our analysis model.
    • The basic syntax for creating a DAX formula and using DAX functions.
    • How to create calculated columns and add new text, date and numeric figures for reports.
    • How to create a new table using DAX.
    • How to create a Calendar table in order to create date-based visuals.
    • How to use the RELATED function to include related columns in parent tables in calculations.
    • What is a DAX Measure, and how it differs from a calculated column formula.
  • How to publish a report to your personal workspace in the Power BI Service, and how shared workspaces work.
    • What the Power BI Service is, and how it fits into the overall Power BI infrastructure.
    • How the Power BI Service is organised into workspaces, reports, data sets and dashboards.
    • The basic licensing options and requirements doe sharing and collaborating on reports.
    • How to publish a report into your personal workspace.
Power BI Learning and Support helps you to create interactive reports for business insights

Course Categories

Product: Microsoft Power BI
Category: Report Design, Data Modelling and DAX Calculations
Level: L1 Beginner

Duration, Participants & Price

Duration: 4 x 3 hour sessions.
Class size: Maximum of 6 participants.

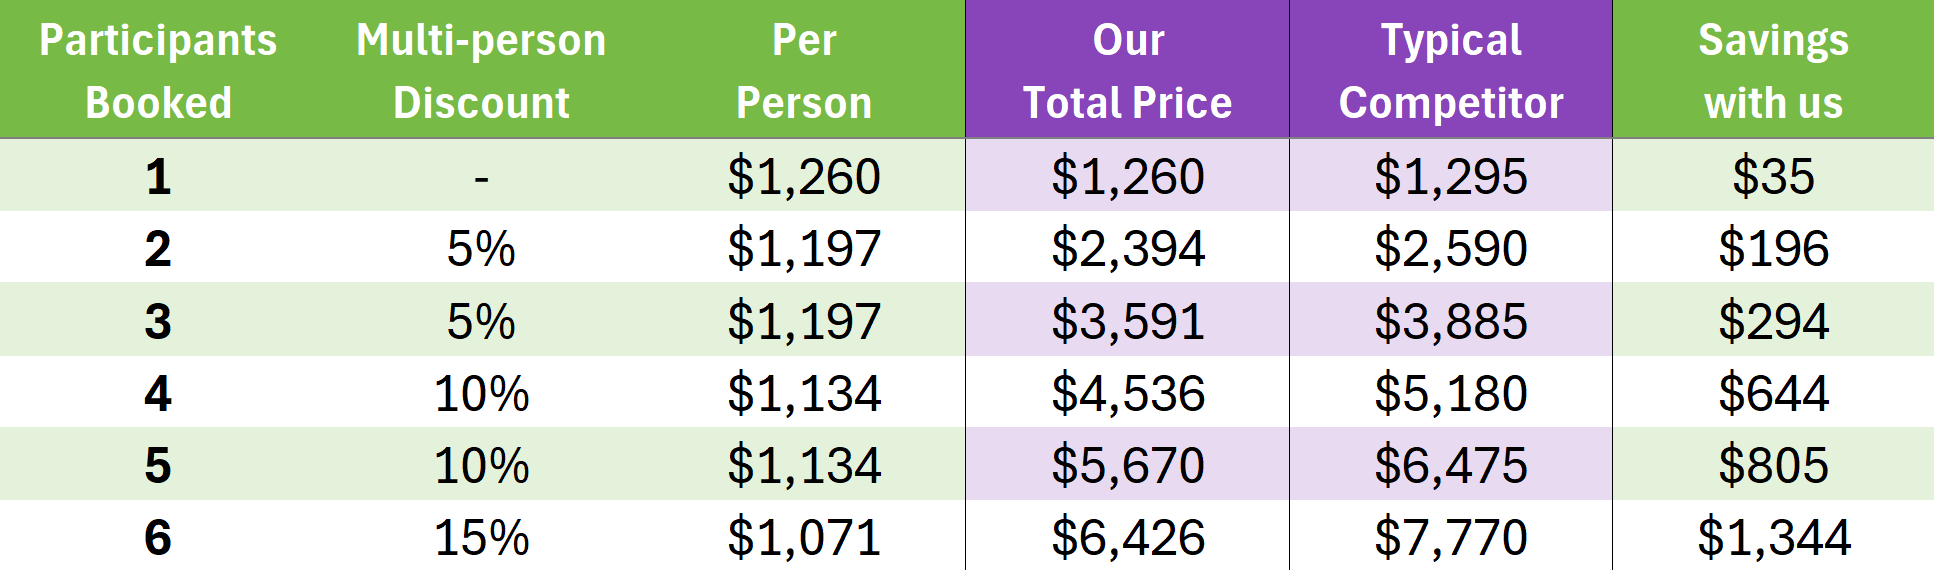
Pricing: is shown below and depends on the number of participants booked.