The future of Live Interactive Learning: ½ day sessions using Zoom - with the topics you need - just when you need them.
We NEVER cancel a course - even if there's only one attendee!
No scheduled course when you want it? Easy - just schedule one on the dates you prefer!
Maximum class size of 6   +   Short ½ day sessions   =   Better learning outcomes + Less time away from work.
Independent instructors with lower overheads = Better value for money options.
Cancel or reschedule up to 24 hour in advance + Money back guarantee = NO RISK! 
Free and indefinite post-course support from your instructor = We care about and support your learning journey all the way.

Advanced visuals and techniques

Learn more visuals and advanced reporting techniques to make your reports more professional and valuable.

In this course you will learn:

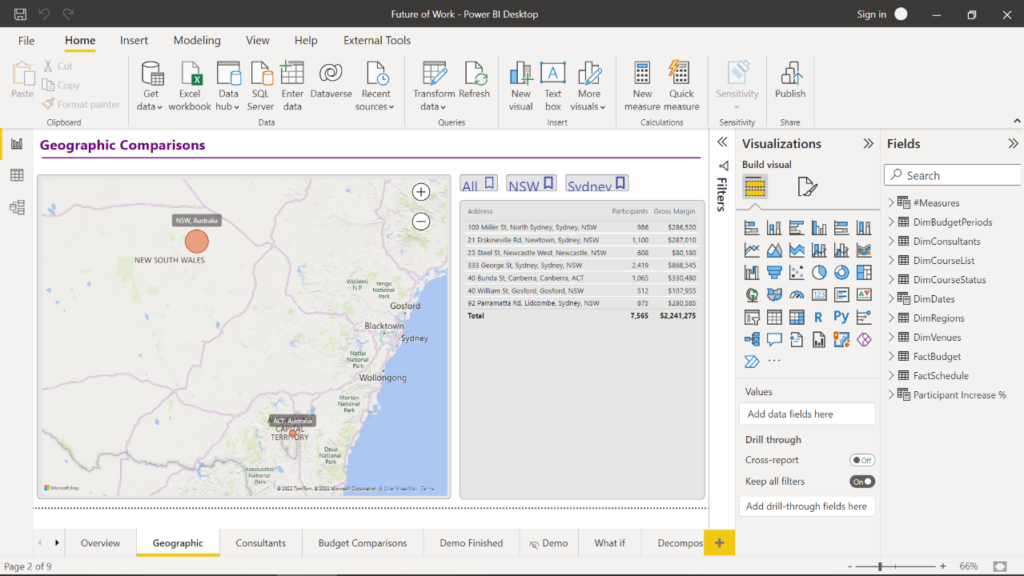
  • How to use more visuals, including advanced tables, matrices, correlation charts
  • How to use the new button slicer and card visuals.
  • How to set-up and use some of the more advanced AI visuals.
  • How to create more advanced timelines.
  • Adding trend lines and other chart analytical features.
  • How to drill through from one page to another using the filters on the current page.
  • What a measure is and how to add them to you report.
  • How to create and use field hierarchies.
  • How to customise visual interactions.
  • How to synchronise slicers across pages and create a common filter interface
  • How to create advanced tooltips from other report pages.

Current Scheduled Courses

Click Book New to schedule a course on your preferred dates.
Seats: 6

Pre-course Requirements

Required knowledge. Before attending this course you must have met the following pre-requisites:

  1. Completion of the Power BI: Kickstarter (Level 1) course AND have some practice creating reports using the core visuals.

Pre-course Setup Checklist. There is a pre-course setup checklist which you must complete before your first session to ensure you have the correct software and hardware installed and configured before you can attend the course. This will also be sent out to the participants after the booking is complete.

Training Resources

The following resources are provided as part of this course:

  • Cheat sheets. Core concepts and some 'how to' guides are provided in cheat sheets to help apply the knowledge and skills back in the workplace.
  • Exercise files. Class exercise files and data sources are provided, which are used during the sessions and which can also be used for further practice after the sessions.
  • PowerPoint Slides. A copy of the PowerPoint slides used throughout the course will be provided so that participants do not need to try and copy slides, or write extensive notes throughout the course.

A link to download the training resources in 'zip file' format will be sent out to students after booking for the course. These files will need to be extracted prior to the first session.

What's next?

The following courses can also be completed following this course and provide more skills and knowledge in creating DAX Measures and Data Modelling:

For the full Power BI course offerings and pathways click here.

Course Categories

Product: Microsoft Power BI
Category: Designing Reports
Level: L2 Intermediate

Duration, Participants & Price

Duration: 1 x 3 hour session.
Class size: Maximum of 6 participants.

Pricing: is shown below and depends on the number of participants booked.